- tl;dl
- Posts
- #63 OOH Strategy: What We Did, What Worked, What Didn't
#63 OOH Strategy: What We Did, What Worked, What Didn't
The best thing out-of-home did for our pipeline wasn't impressions.
Senda from tl;dl
April 25, 2026
The overall bet
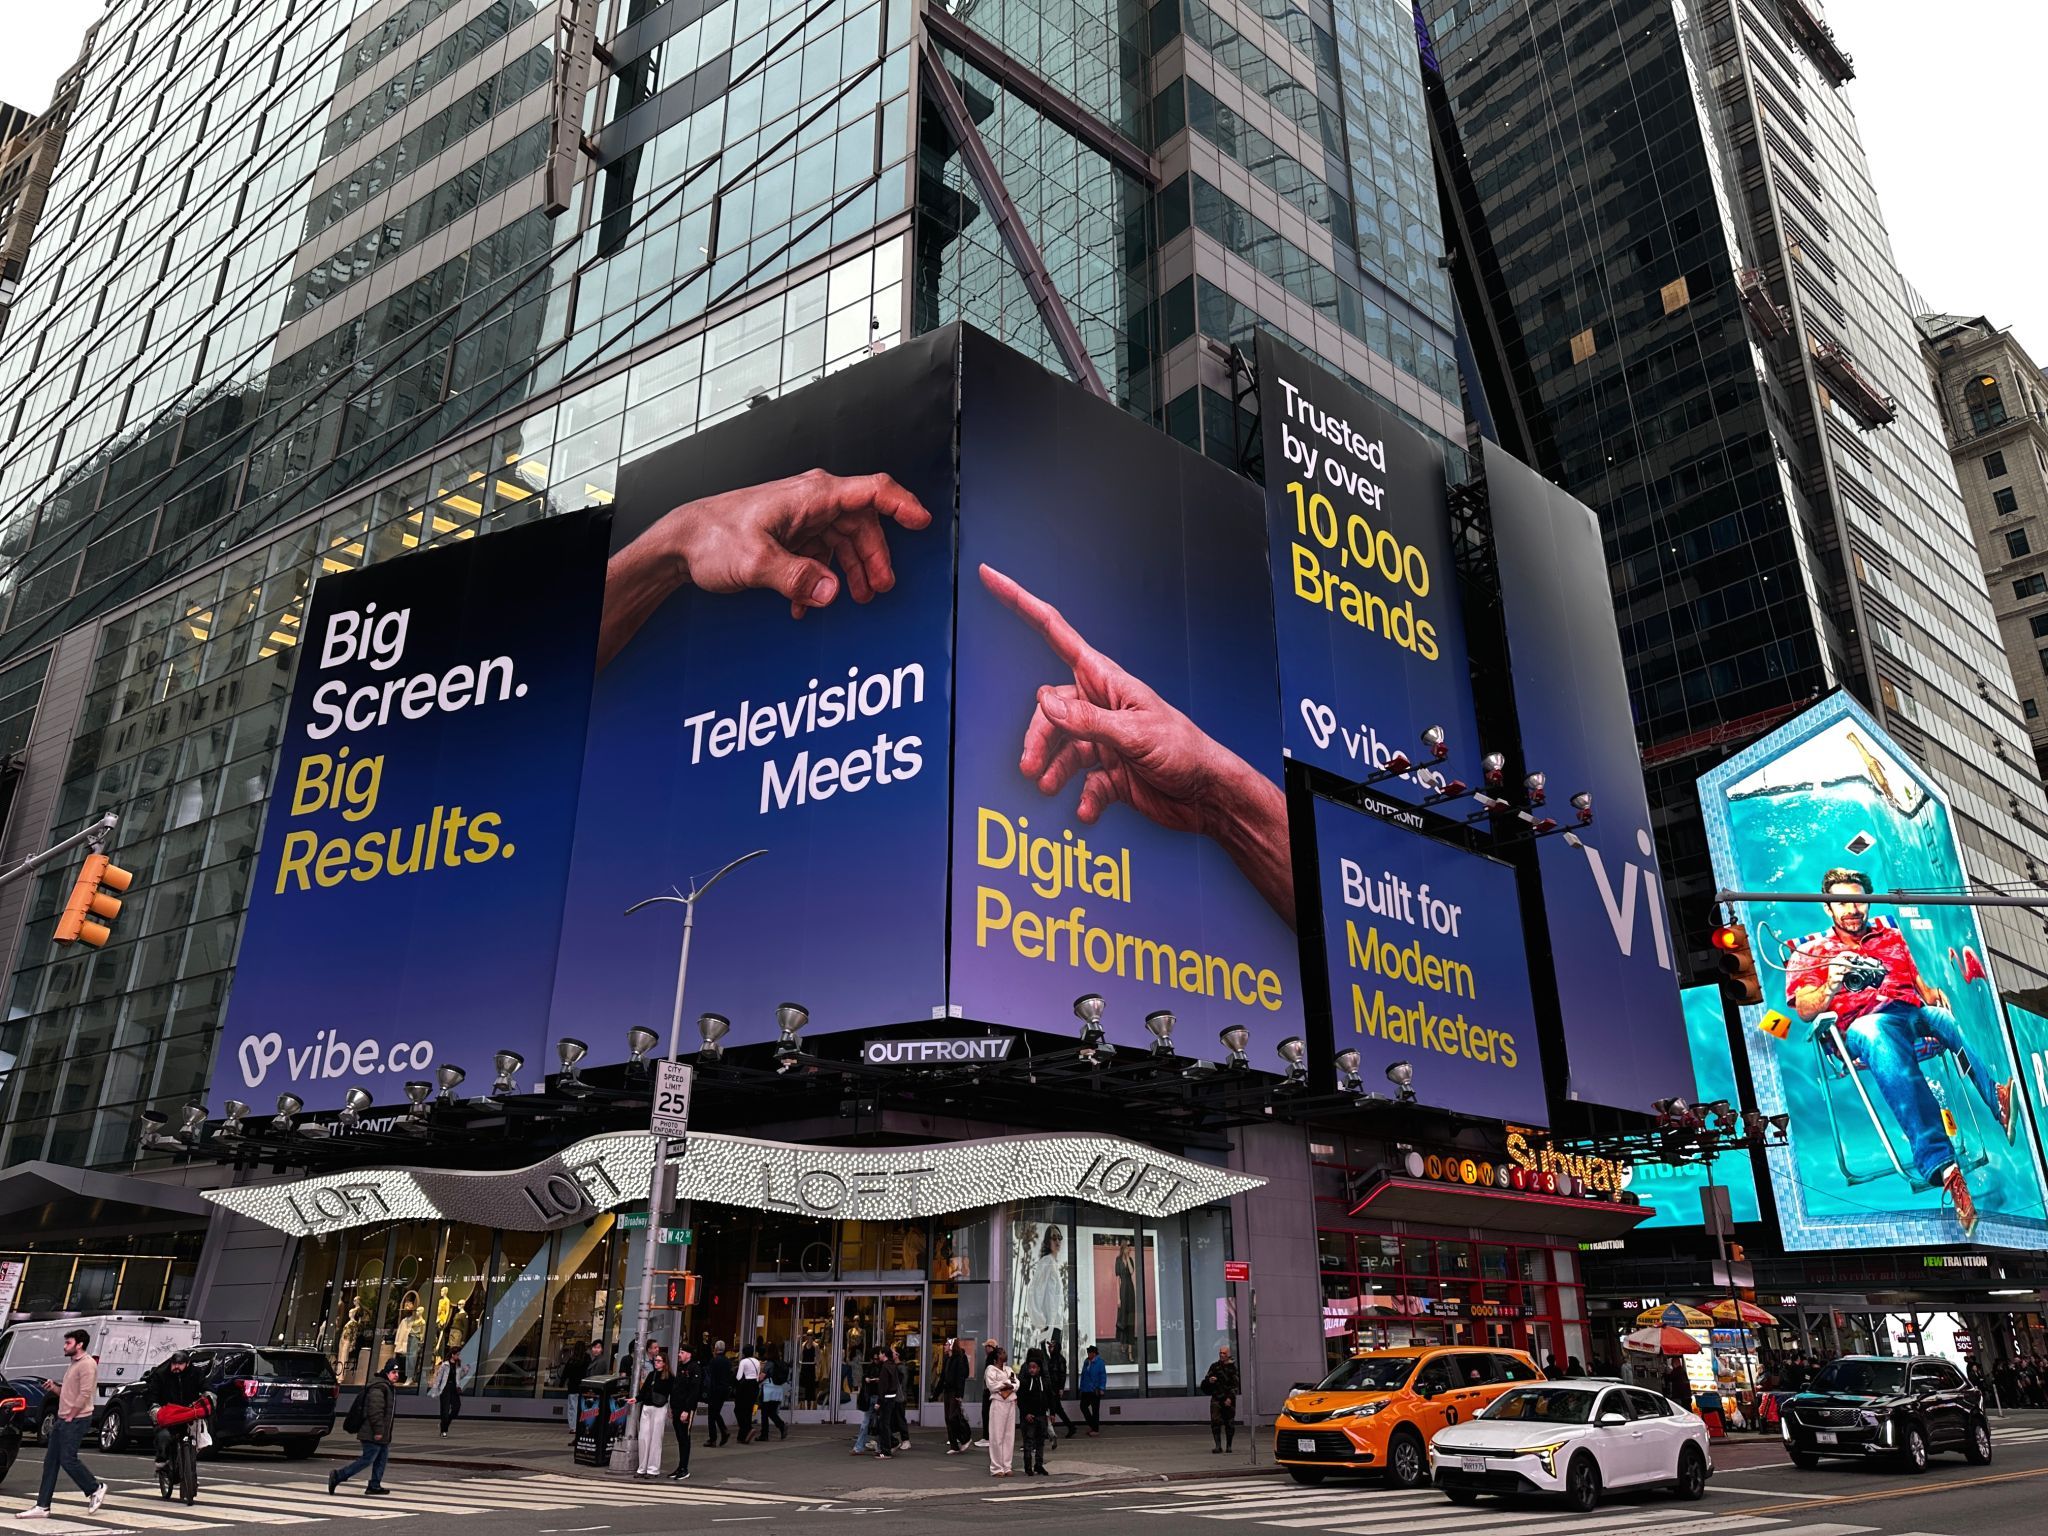
We ran a sustained, multi-city OOH program across NYC and SF from January through (at least) July 2026. This wasn't a one-week splash. It was a coverage play: be visible in the markets where our buyers, prospects, and talent live and commute, long enough that the name starts to mean something before anyone looks us up.
The hypothesis: CTV is still an education sale. OOH shortens that. If a performance marketer sees Vibe on a billboard, then on a podcast ad, then in their LinkedIn feed, the third touchpoint converts differently than the first.
What we ran
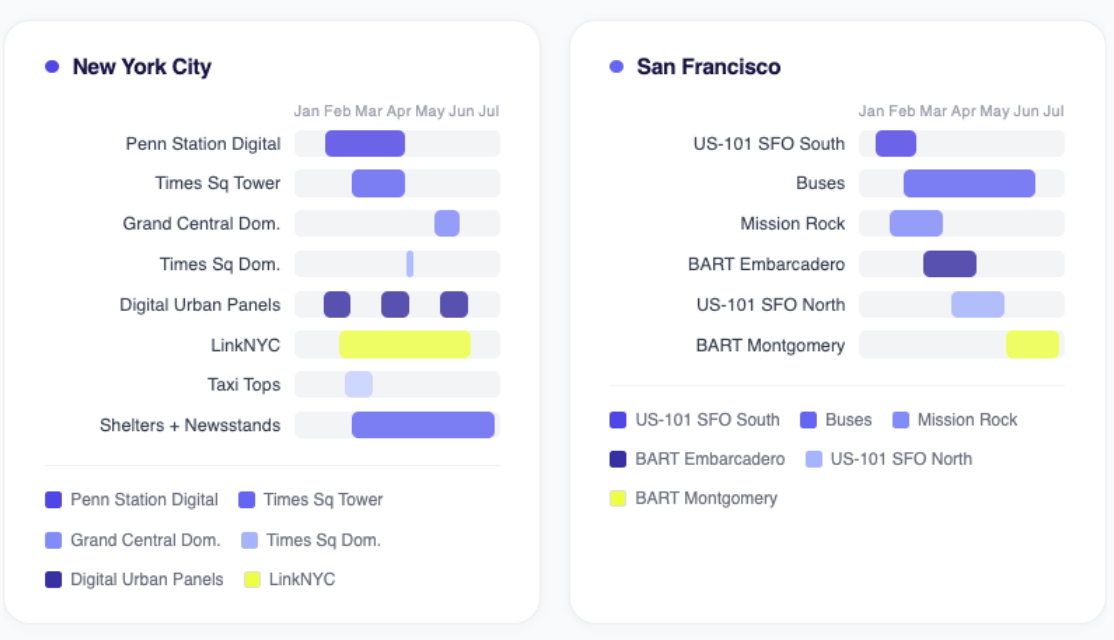
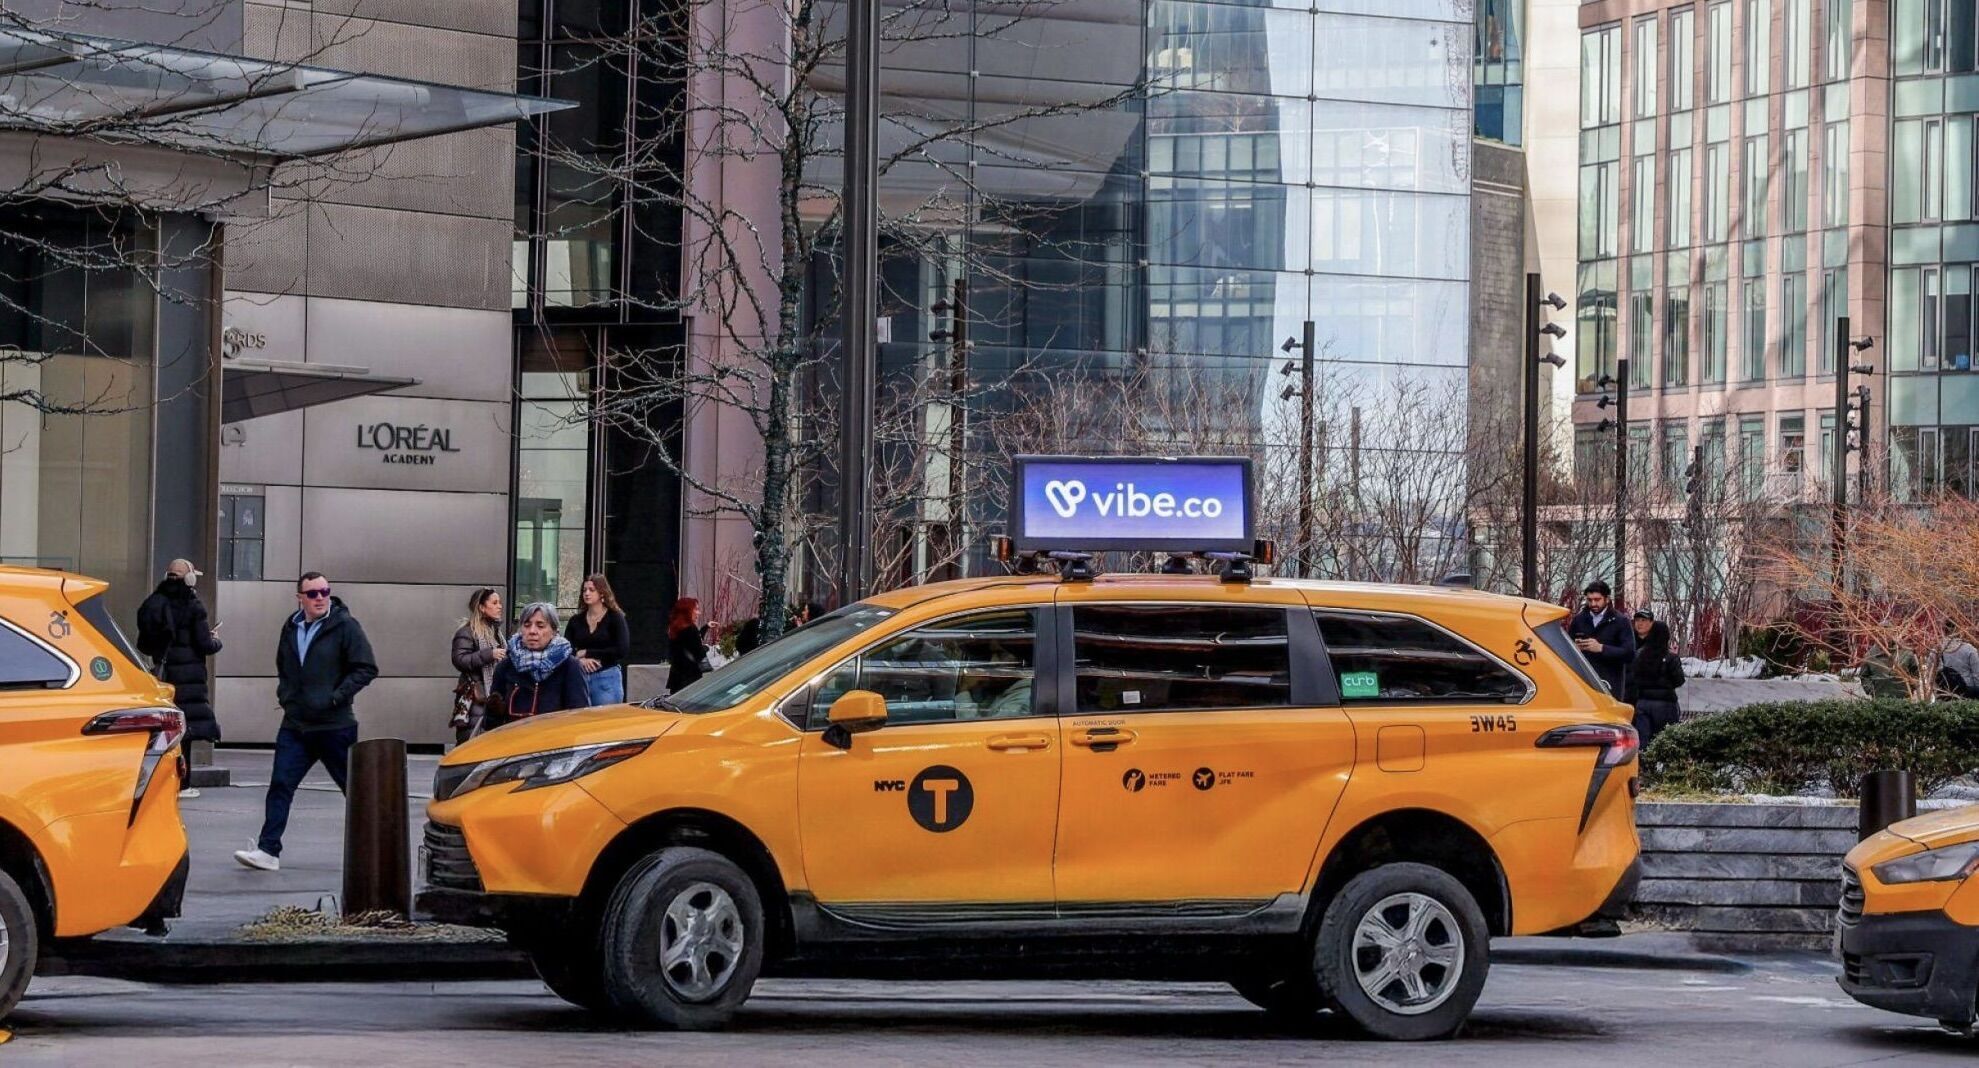
NYC was the primary market. We had Penn Station digital placement running February through late April, the Times Square tower static from March through April, taxi tops for four weeks in February, LinkNYC panels running February through July, static shelters and newsstands from March through July, and the two station dominations: Times Square the last week of April into May, Grand Central in late May through June.
SF ran in parallel. US-101 SFO billboards (first southbound, then northbound), Mission Rock, BART Embarcadero from March through May, buses running February through July, and BART Montgomery starting June.
The most concentrated moment was mid-to-late April in NYC. Penn Station, Times Square tower, LinkNYC, shelters, and the Times Square domination all overlapping. That was the peak density window.
The wins
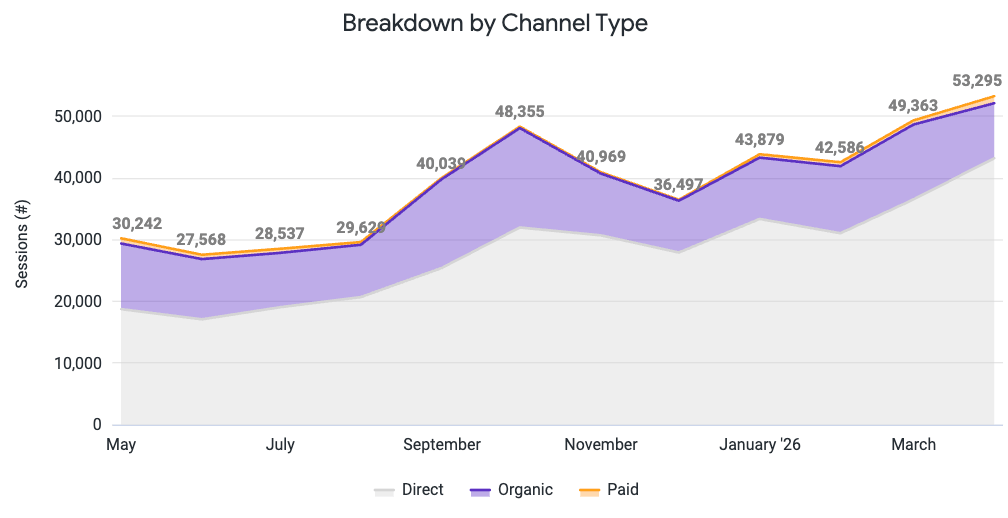
Organic brand traffic went up (x3). Not linearly, not cleanly attributable, but the trend line from the Looker data moves in the right direction after OOH launch in February and spikes again around the domination periods.
The internal effect was real. Sales team confidence shifted noticeably. People started mentioning the campaign on calls. Prospects referenced it. The "I've been seeing you everywhere" moment happened, which is the OOH signal you're actually looking for.
BART Embarcadero was a sleeper win. SF brand awareness was lower baseline than NYC so the signal was cleaner. A dedicated audience, high frequency, commuters who see the same ad five days a week. That format punches above its cost.
The Times Square station domination generated organic social. People posted it. Employees shared it. We didn't have to brief anyone to amplify it. That's the test of whether OOH actually landed.
The losses
Attribution is genuinely hard and we didn't solve it. We built the Looker visualization to map placements against traffic trends, which helped tell the story, but we can't draw a clean line from any individual placement to a conversion. That will remain a gap unless we invest in brand lift studies or phone home surveys.
Timing gaps hurt. There were windows where NYC coverage dropped between placements ending and new ones starting. The Times Square tower ended and there was a gap before the domination week. Continuity matters more than individual placements and we didn't always have it.
We ran a lot of formats simultaneously, which made it hard to know what was doing the work. Penn Station vs. taxi tops vs. LinkNYC vs. shelters. No holdout, no isolation. Good for coverage, bad for learning what to double down on.
Some of the static placements probably didn't move the needle on their own. Shelters and newsstands are high volume but low attention. They work as frequency plays when layered on top of hero placements, but they're not where the magic is.
What we learned
Frequency over reach. A commuter who sees your ad 20 times at BART Embarcadero is worth more than 20 different people who each see it once.
OOH needs a social layer. Every major placement should have a corresponding push to capture the organic moment. Behind-the-scenes content, employee photos, "we're here" posts. We did some of this well and some not at all.
Internal activation is free and we underused it. Briefing the sales team, giving them assets, making them feel famous before the campaign launched would have compounded everything else.
The measurement story we can tell is: brand search volume trends up, organic direct traffic climbs, inbound quality improves in the months we're running heavy. That's the narrative. It's not a clean attribution story. It's a confidence story. And it's true.
To wrap up, here’s my personal favorite:
in US-101 San Francisco
What’s cooking 🧑🍳
Stay tuned for more tl;dl episodes coming soon where I talk to B2B marketers about their product marketing strategies and approach. I’ll also be posting more updates on here. See you soon!